NHL Regression Classification Analysis
Project Overview
The analysis explored NHL team season data (url: https://www.kevinsidwar.com/iot/2017/7/1/the-undocumented-nhl-stats-api) from 1983 - 2020 to predict season and playoff outcomes. The season outcomes were calculated by how many adjusted wins a team won (wins + (ties / 2)) above the mean adjusted wins of any given season. The season outcome was calculated this way due to the varying nature of hockey; in some seasons, teams were closer in regards to games won and some had a greater divide. In addition, some seasons were longer than other seasons and by using the adjusted games a team won (wins + (ties / 2)) above the mean adjusted wins of any given season metric, all seasons were included in the analysis despite some seasons having less games played (shortened due to strike and pandemic). The season outcomes calculated in the way mentioned above will help predict and understand playoff outcomes more efficiently. More than 60% of teams make the playoffs, so the analysis set out to predict teams that did not make the playoffs. The entirety of the analysis sought to understand the statistical economics of what NHL team organizations can focus on to reach the post-season. By understanding the economics of what hold teams back from making playoffs, teams can gain more transparency and perspective on what works with strategy and achieving successful campaigns in mind. Achieving successful campaigns can potentially lead to increased revenue for all stakeholders through ticket sales, salary increases, endorsement deals, fair book value of the organization, greater economic activity for the represented city, etc.
Methods Used


Results
Multiple Linear Regression to Predict Season Outcomes
Model Features:
- Shooting Percentage (shootingPctg)
- Save Percentage (savePctg)
- Shots Per Game (failedShotsPerGame)
- Percentage of Games Won when Team Scores First (winScoreFirstGreater61_low)
- Save Per Game (savesPerGame)
Model Target:
- Above the Mean Adjusted Wins (aboveMeanAdjWins)
Model Results on Test Data:
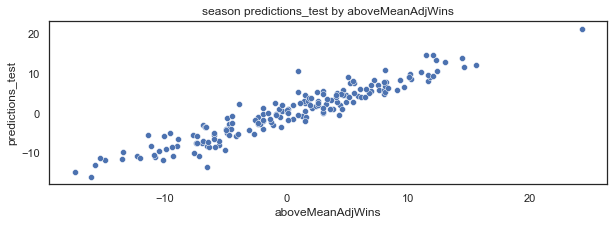
- r2: 0.90
- Mean Absolute Error: 1.79
- Mean Squared Error: 5.32
- Root Mean Squared Error: 2.31
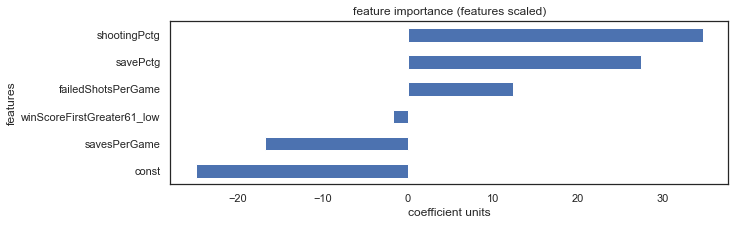
Model Feature Coefficients:
- Shooting Percentage (shootingPctg): 3.99
- Save Percentage (savePctg): 3.92
- Shots Per Game (failedShotsPerGame): 1.36
- Percentage of Games Won when Team Scores First (winScoreFirstGreater61_low): -1.74
- Save Per Game (savesPerGame): -1.40
Model Feature Importance:
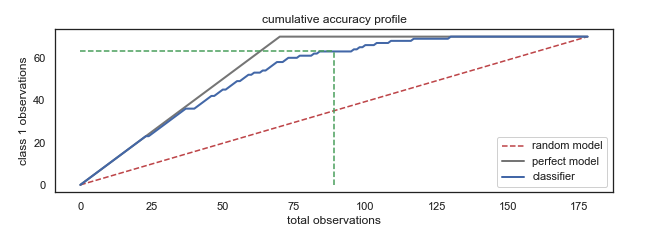
Logistic Regression Using Predicted Season Outcomes to Predict Playoff Outcomes
Model Feature:
- Predicted Above the Mean Adjusted Wins (predAboveMeanAdjWins)
Model Target:
- Above the Mean Adjusted Wins (aboveMeanAdjWins)
Model Results on Test Data:
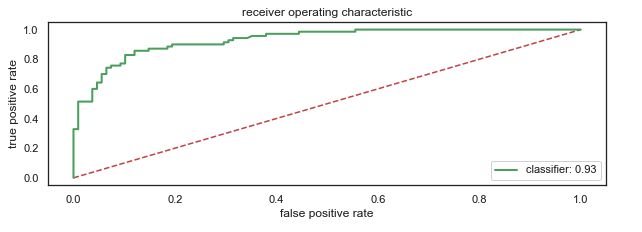
- Concordance: 0.94
- AUC: 0.94
- Accuracy: 0.86
- Percision: 0.94
- Recall: 0.85
- F1: 0.89
- Kolmogorov–Smirnov Measure (KS): 44% at the 4th decile, a cumulative percentage 2.1 times (84% (model) - 40% (random model)) greater than a random model.
A/B Testing on Predictor Features
If teams want to make the playoffs they need to increase their aboveMeanAdjWins. To increase their aboveMeanAdjWins, teams should take into consideration the following:
Note - all p-values are significant as p < 0.05.
- shootingPctg strive to achieve 10.84% shooting percentage and stay within range 10.3%, 10.48%, 10.67%.
- savePctg strive to achieve 90.21% save percentage and stay within range 90.02%, 90.21%, 90.4%.
- savesPerGame strive to achieve 26.12 saves per game and stay within range 25.82, 26.12, 26.42.
- failedShotsPerGame strive to achieve 27.17 shots per game and stay within range 26.91, 27.17, 27.43.
- winScoreFirstGreater61_low strive to win 82% of games they score first and stay within range 75%, 82%, 88%.
- aboveMeanAdjWins strive to achieve 4.3 shots per game and stay within range 3.62, 4.3, 4.98.
Technologies


